Over the years I have been always fascinated by programming and searching for new ideas to explore in various fields including Big Data machine learning. As in all cases, funding is essential and research funds are a solution. My interests in energy efficiency and machine learning have taken me to image-based analysis for improving photovoltaic output forecasts. The problem is not an easy one, many numerical and image-based solutions try to solve it. For this particular case, I was motivated by short to mid-term forecasts based on images which some studies suggest are more effective than numerical ones. In contrast, numerical methods work best for mid to long-term forecasts. Quite intuitive as you might suspect since short and mid-term forecasts several hours ahead can be done by monitoring the evolution of clouds in the visible sky up to the horizon. I investigated this problem as PI together with my team comprising Marius Penteliuc, Dr. Adrian Spataru, and Prof. Dr. Marius Paulescu.
The problem
The renewable energies market around the world has seen a growth in photovoltaic (PV) farms. One major problem PV farms’ owners have to deal with is a lack of an accurate prediction model meaning usually they rely on wide area low-resolution forecasts instead of localized high-resolution ones. This in turn causes losses, especially for the day-ahead market which requires accurate forecasts of the PV output and thus accurate cloud coverage data.
The project
The Cloud2Energy project (Cloud on cloud dynamics for photovoltaic energy generation prediction) ran between 2020-2022 and aimed to address some of the challenges by proposing simple models that work on commodity machines and with publicly available images (satellite or ground-based) combined with ground-monitored radiation under various conditions (clear skies, variable, cloudy). In our research, we relied on Sentinel-2, Landsat, GOES, and Meteosat images as well as on solar radiation data from the solar platform installed at the West University of Timisoara, Romania.

The solution
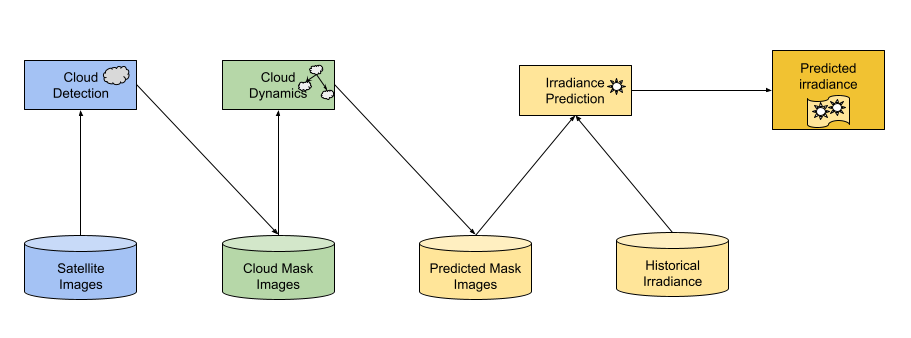
Generally speaking, the processing starts with an image from which clouds are first extracted, dynamics are forecast, and based on the predicted pixel value (black if no cloud and a shade of gray or fully white in case of clouds) the solar radiation level is forecast by using historical correlation (between pixel values and solar radiation) and a linear regression model. The figure below shows this process.
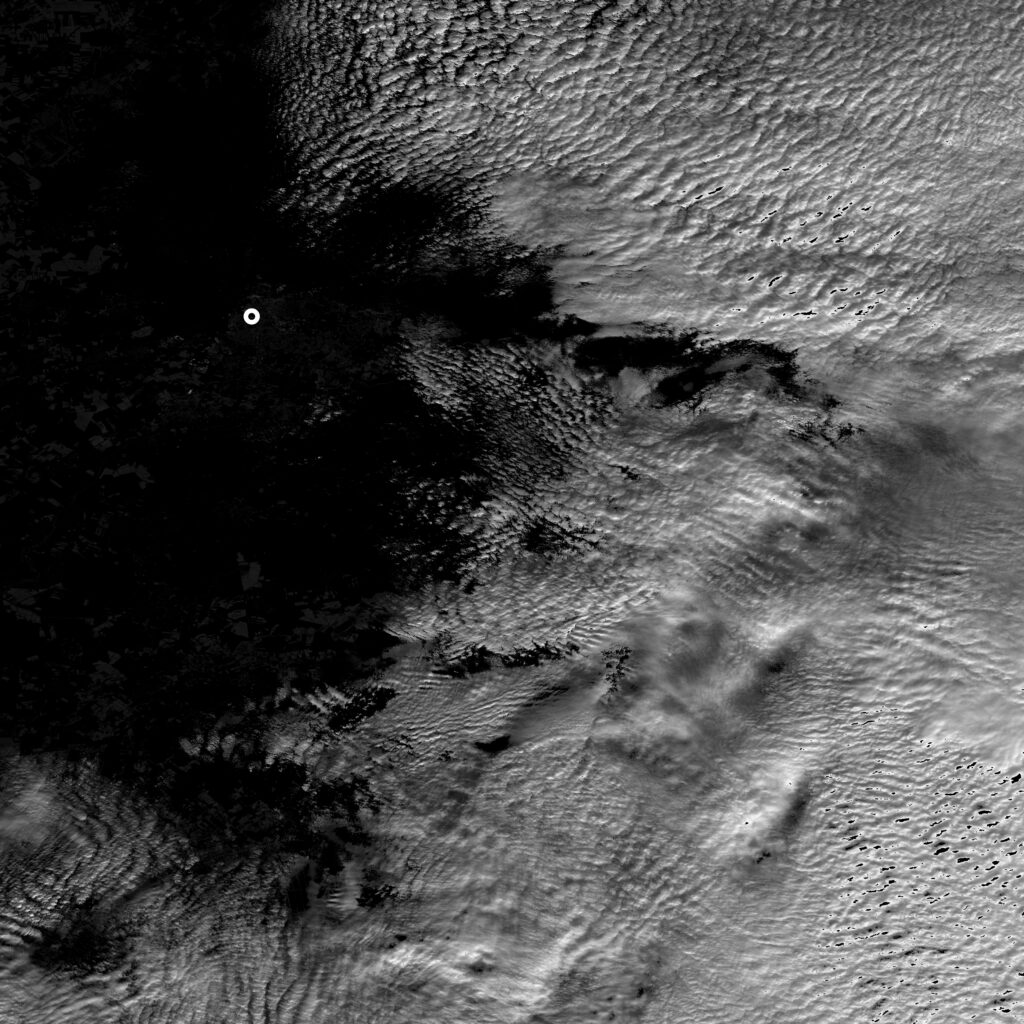
During this project, we tested a version of the Boids Flocking algorithm for forecasting cloud dynamics in satellite images (taken at higher frequencies from geostationary satellites such as Meteosat or GOES or even ground-based cameras although we have tested the cloud detection algorithm on Earth Observation imagery as well such as that from Sentinel 2) and created CUDA and OpenMP versions of it. Cloud masks are extracted by using a thresholding algorithm (see figure below). We have tried several cloud-type detection algorithms, however, we found the results to be varying based on the given parameters and thus rolled back to a cloudy pixel-based analysis only ignoring the cloud type completely.
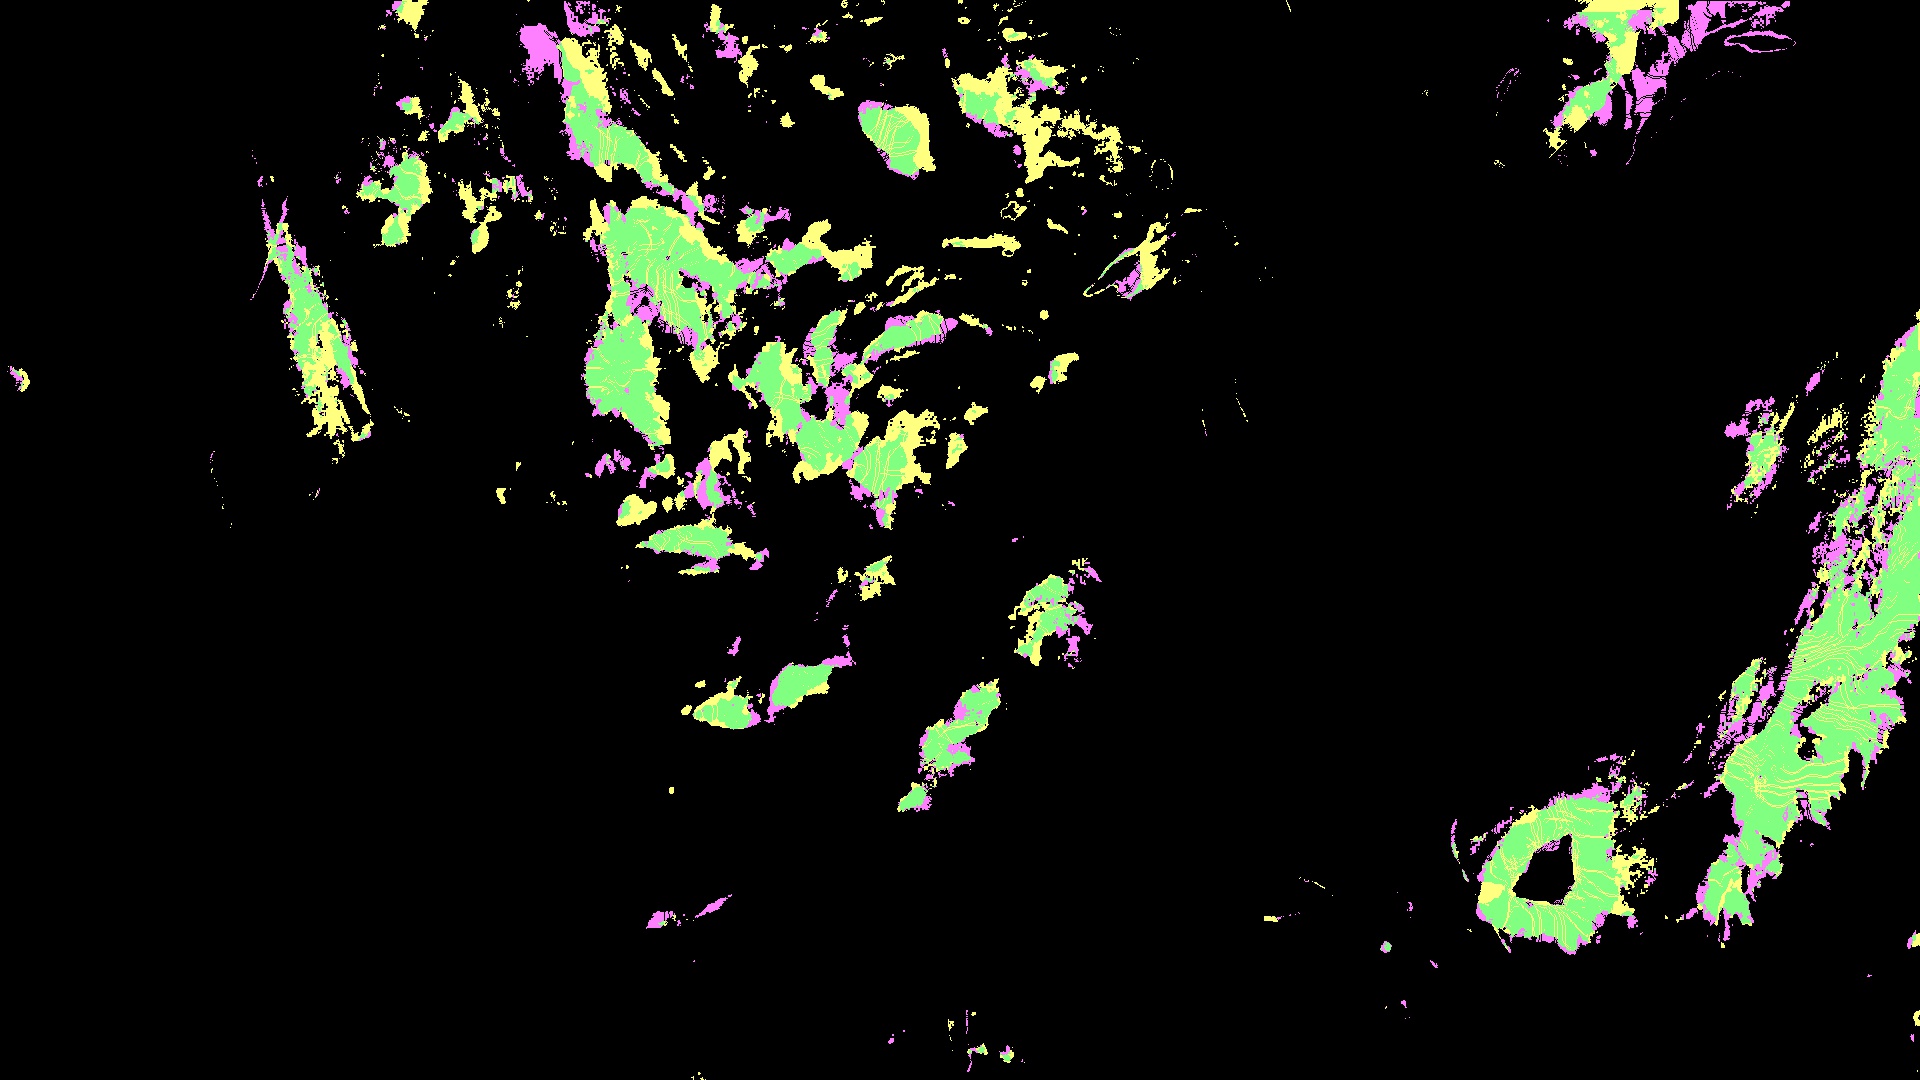
The figure below shows the achieved forecasts for 1, 3, and 15-hour future windows. Based on these forecasts we have attempted to use various spectral bands (including TCI – True Color Images – RGB) to forecast the radiation levels based on cloudy pixel values.

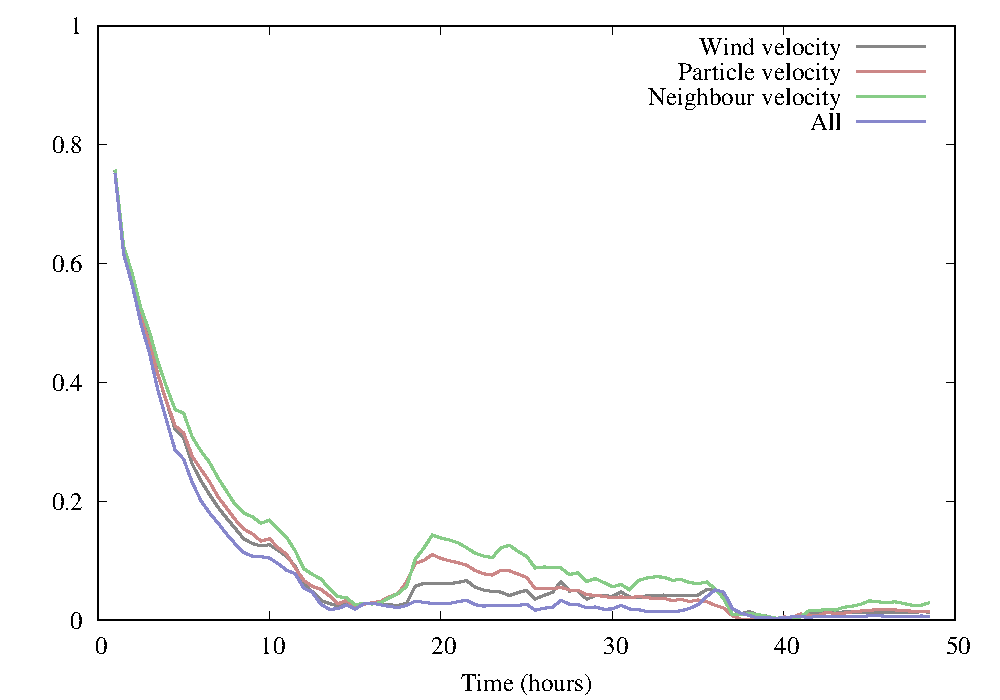
The F1-score for our cloud dynamics forecasts is around 0.75 (1 being the best value) within the first hour and drops to 0.2 after 10 hours. See the figure below for a plot.
While performing correlation analysis we found that the Global Irradiance was correlated with individual bands such as the aerosol, blue and green bands, and the mask of all clouds. This allowed us to perform linear regression to infer the future value. In the process, we used three different metrics depending on the objective.
The conclusion was that we can use simple (low complexity) yet efficient algorithms to achieve fairly accurate short-term forecasts (up to 4 hours ahead) based solely on information from images and to generate solar irradiance forecasts based on historical cloudy pixel value – measured irradiance correlation.
Future work will possibly investigate the application of our results on a real-life PV farm.
Code
- The CUDA version for the Boids Flocking Algorithm modeling wind dynamics can be accessed at https://github.com/adispataru/CloudMovement-CUDA
- Code and docker image for the cloud detection and dynamics as well as for radiation correlation can be accessed at https://drive.google.com/drive/folders/1RfzOITNA96Qz_6a1XMs0aFi8x_A684Td?usp=sharing (the link includes sample satellite images)
Publications
- Marc Frincu, Marius E. Penteliuc, Adrian Spataru: A Solar Radiation Forecast Platform Spanning over the Edge-Cloud Continuum. Electronics 11 (17), 2022: 2756 (IF: 2.69)
- Marius E. Penteliuc: Cloud Movement Forecasting based on Wind Modeled from Satellite Imagery and a Modified Flocking Algorithm. Ph.D. Thesis (West University of Timisoara), 2022.
- Marius E. Penteliuc: Processing Large Satellite Imagery to Estimate Solar Irradiance. IEEE BigData 2021: 5985-5987
- Marius E. Penteliuc, Marc Frîncu: Short Term Cloud Motion Forecast based on Boid’s Algorithm for use in PV Output Prediction. ISGT-Europe 2021: 1-5.
- Adrian F. Spataru, Larisa Cristina Tranca, Marius E. Penteliuc, Marc Frîncu: Parallel Cloud Movement Forecasting based on a Modified Boids Flocking Algorithm. ISPDC 2021: 89-96
Funding
The project was supported by a grant from the Romanian Ministry of Education and Research, CNCS-UEFISCDI project number PN-III-P1-1.1-TE-2019-0859 within PNCDI III. The grant value was 78,855.32 EUR (370,620.00 RON).